

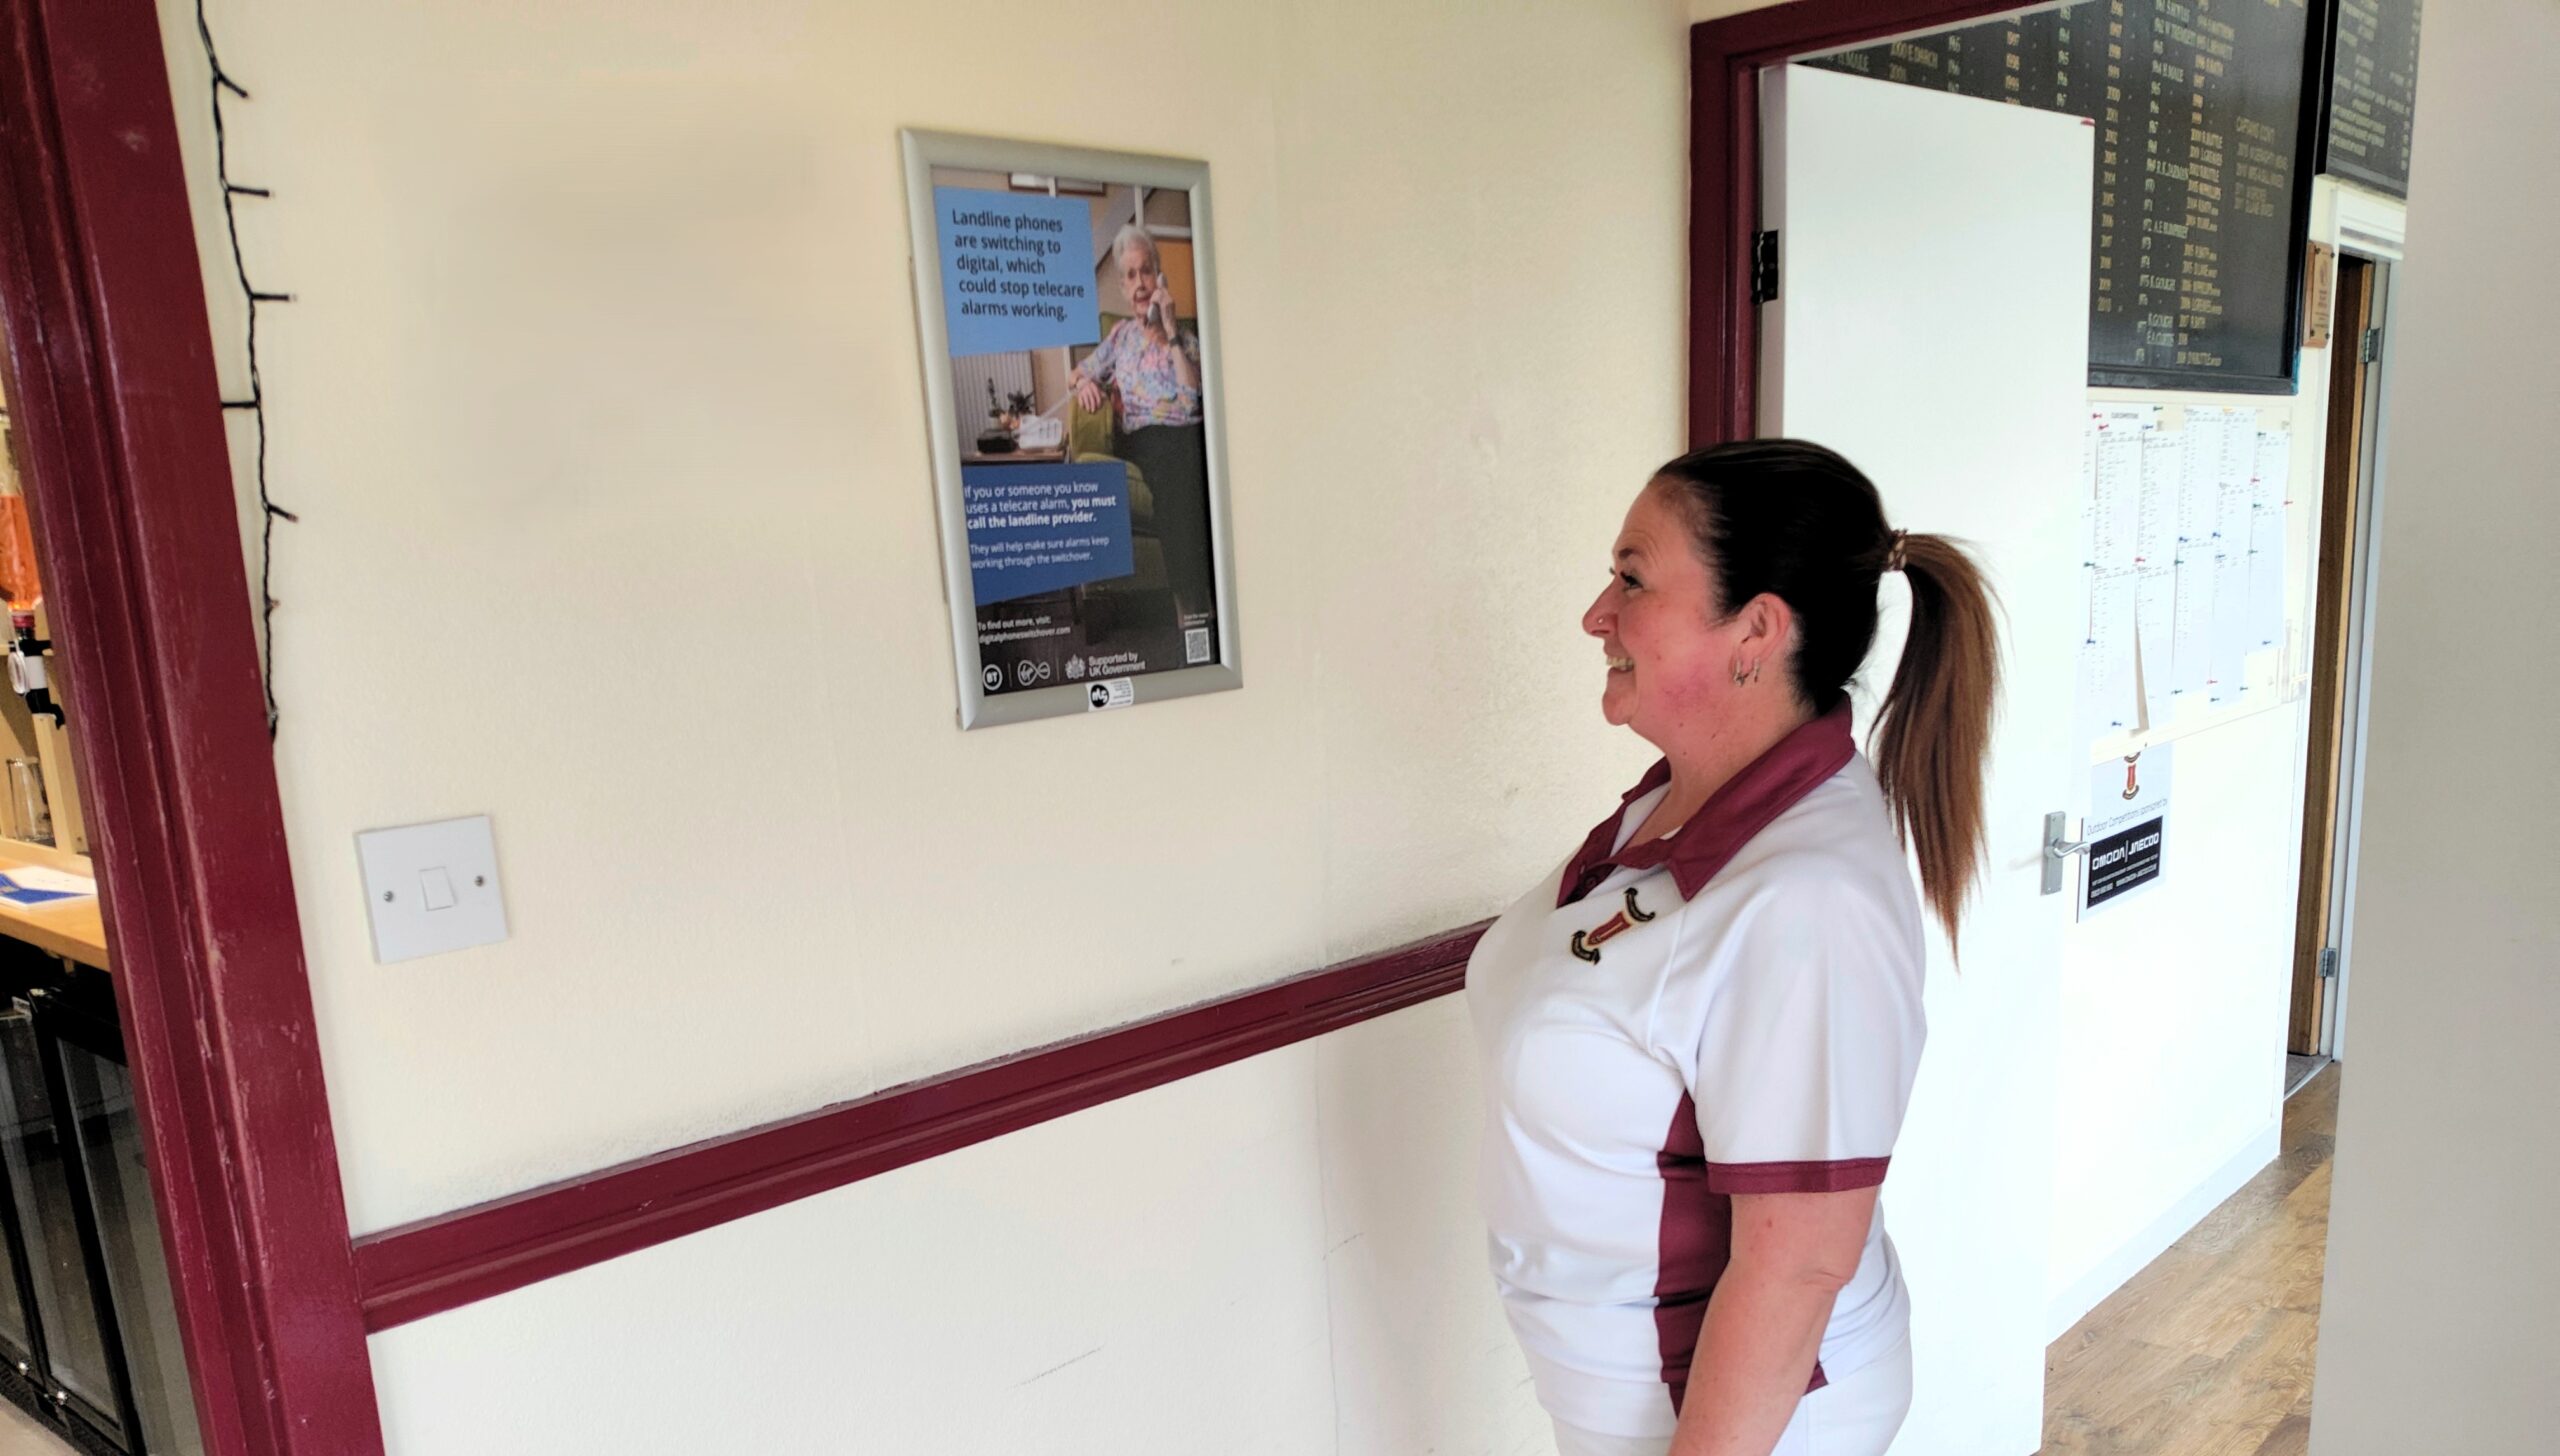
At Grassroot Media, we pride ourselves on transparent, defensible audience calculations. Here’s a step-by-step breakdown of how we derive our metrics for bowls club posters, using real club data and conservative assumptions.
1. Starting Point: Club Membership
We begin with average club membership (250 per club), sourced directly from club records. This isn’t an estimate—it’s verified data from our partner venues.
2. Breaking Down Player Visits
We categorise members based on weekly participation:
- Playing Members (75% counted):
- 25% visit once/week → 62.5 members × 1 visit = 62.5 visits
- 25% visit twice/week → 62.5 members × 2 visits = 125 visits
- 25% visit three times/week → 62.5 members × 3 visits = 187.5 visits
- 25% don’t play weekly → excluded
- Socialising Members (75% counted):
- 50% socialise once/week → 125 members × 1 visit = 125 visits
- 25% socialise twice/week → 62.5 members × 2 visits = 125 visits
- 25% don’t socialise → excluded
- Visiting Players:
- Add 50% of membership (125 away players) per week → 125 visits
Total Weekly Visits per Club:
62.5 + 125 + 187.5 + 125 + 125 + 125 = 750 visits
3. Inclusions and Exclusions
- Included:
- Open days, community sessions, and non-member events.
- Larger venues (e.g., indoor centres hosting competitions) use the same 750-visit baseline for consistency, even when actual footfall is higher.
- Excluded:
- Private hires (weddings, functions).
- The ~10% of members visiting >3 times/week (we cap at three for conservatism).
4. Poster Impressions: 2.5 Views/Visit
Each poster delivers 2.5 views per person per visit—a conservative figure based on:
- Attention advantage: Posters are in high-traffic areas (entrances, bars), where dwell time is 1–2 hours.
- Low ad clutter: As the only ads in these spaces, recall is high (e.g., Octopus Energy achieved 87% recall).
- Real-world validation: Case studies show this figure is likely understated, but we prioritise defensibility over inflation.
Impressions Formula:Weekly Impressions = Posters per Club × 750 visits × 2.5 views
5. Seasonal Adjustments
- Outdoor Season (Apr–Oct): Full 750 visits/club/week.
- Indoor Season (Nov–Mar):
- Footfall drops 40% → 450 visits/club/week.
- Views remain 2.5/visit: Indoor venues have higher dwell time, but we keep this unchanged for simplicity.
6. Why This Methodology Works
- Transparency: Every assumption is shared, no hidden multipliers.
- Conservatism: We exclude marginal groups (e.g., super frequent visitors) and use lower-bound estimates.
- Real-world alignment: Matches observed behaviour (e.g., socialisers spend 2.5+ hours onsite).
- Scalability: Applies uniformly across 118+ clubs, from small greens to “warehouse-scale” indoor centres.
Example: A club with 2 posters:
- Weekly Impressions: 2 × 750 × 2.5 = 3,750
- Fortnightly Campaign: 3,750 × 2 = 7,500
7. Validation: Octopus Energy Case Study
Our methodology isn’t theoretical—it drives results. The Octopus Energy campaign achieved:
- 87% brand recall
- 62% uplift in brand affinity
…proving that even conservative estimates deliver high-impact engagement.
Final Notes
We’re open about our calculations because we believe media buyers deserve honesty. If you’d like to test our assumptions or request club-level data, email mat@grassrootmedia.co.uk. We’ll share the full workings, spreadsheets included.